Raster Matrix Algebra part 1


In geoinformatics, a raster image is a dot matrix data structure that represents a (generally) rectangular grid of pixels. Most satellite images are stored into a raster file format at some part of the processing chain. GeoTiff and JPG2000 are examples of raster file formats that can have a specific geographical projection stored in the file as metadata, making it easy to combine the data with other geographical data sources.
For analysis, raster files can be loaded into an array in the computer's random access memory using various programming languages. In Python, for example, this can be executed by using the rasterio and imageio packages.
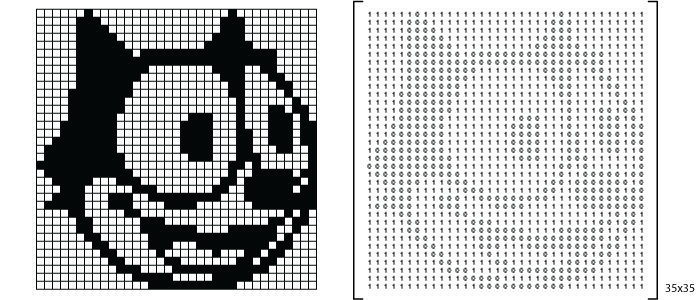
The raster format can be used to store different types of georeferenced measurements or estimates, where each element (pixel) in the matrix represents the value of a single georeferenced measurement or estimate.
Combining multiple measurements
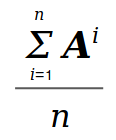
In order to reduce noise in a measurement, it is sometimes useful to combine several measurements. This idea is used for example in HDR (High Dynamic Range) photography where several images taken at different exposure levels are combined to create a better picture. In raster terms, a specific operator is applied to a series of matrices. Probably one of the most simple noise reduction methods is produced by calculating the average of a series Ai of matrices, that is
In cases where noise can cause extreme variations in the data, one might prefer median over average. For this purpose, we define the element-wise median operator with the formula
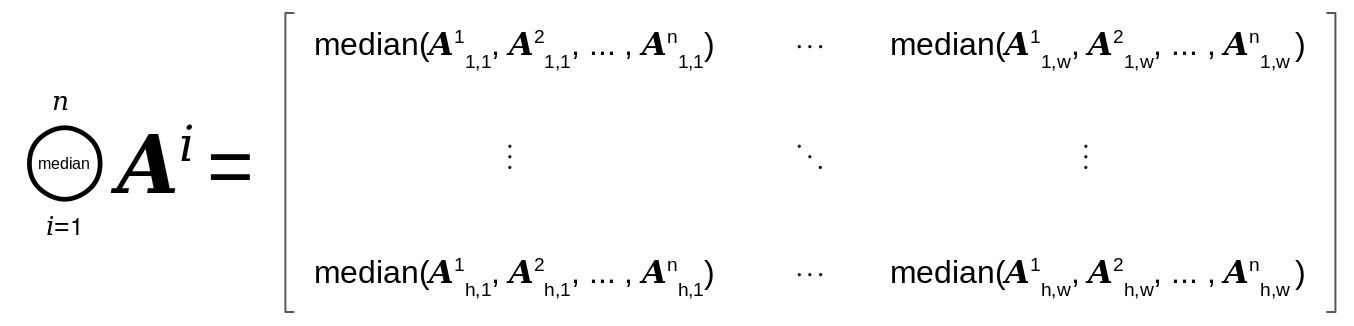
where Aik,l denotes the element k,l of matrix Ai and h and w denote the number of rows and columns in the matrices, respectively.
In cases where it is important to have reliable results and to minimize false positive measurements, the element-wise minimum operator could be useful:
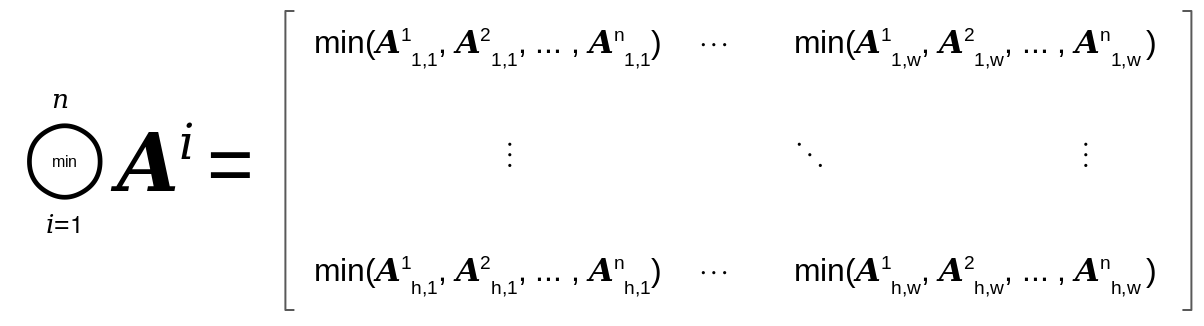
The element-wise maximum operator is defined similarly.
Application to change detection
The element-wise minimum operator has been successfully used in time series change detection. The idea in this case was to combine several pairwise change magnitude measurements into a single change raster between two images (see dashed line in Figure 2).
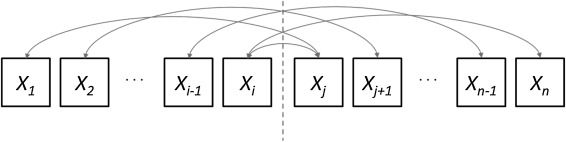
The purpose of this process was to ignore differences between satellite images that do not represent the actual desired changes on the surface of the Earth. Such differences are usually caused by clouds, fog, smoke or smog. Using the time series method and the element-wise minimum operator resulted in a reliable change raster which contains only the changes that are visible in several pairwise comparisons. The time series change raster is given by
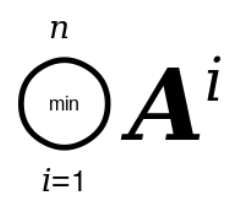
where Ai represents a change matrix between two images for i = 1...n, where n is the number of pairwise comparisons performed on the time series of images.