VESA Index technology

Terramonitor has developed a machine learning based mapping service, which locates harmful shrubs in boreal forests. The service provides valuable information for forest professionals about growth states of forests.
The maps of Terramonitor’s VESA index help forest professionals for fast, easy and financially prudent shrub maintenance. Region-specific maps point the location of shrubs based on algorithmic probability and display the information with color-coded overlays. Based on the map views, the maintenances of forests can be planned predictably, methodically and profitably.
1. Satellite data
VESA Index is calculated using the data from the optical remote sensing satellite Sentinel-2. Sentinel-2 is part of the family of Sentinel satellites operated by European Space Agency (ESA). There are two Sentinel-2 satellites, Sentinel-2A and Sentinel-2B, which were launched to space in 2015 and 2017, accordingly. These two satellites monitor the land surface of the Earth in 5 days. (ESA 2019.)
Sentinel-2 satellites have a multispectral instrument with 13 spectral bands (ESA 2019). Spatial resolution is dependent on the particular spectral band and it is either 10, 20 or 60 metres. The bands are located in visible, near-infrared, red edge and shortwave infrared part of the spectrum. (ESA Sentinel Online 2019.)
The best time for Sentinel-2 images to analyze shrubs in Finland is the peak of the growing season in July and August. Then VESA Index is at its highest and optimally represents the situation of shrubs in seedling stands. This also minimizes the effect of seasonal variation on the index.
2. Ground measurements
The reference data for the development of VESA Index has been used historical procedure information of silviculture and a large number of ground measurements from different parts of Finland. The collection of ground measurements have been carried out in various projects, for example, by Metsähallitus, the Finnish Forest Centre and Otso Metsäpalvelut, also in development project coordinated by Metsäteho and in the project of European Space Agency about Shrub Mapping lead by Terramonitor.
Ground measurements have been collected from areas of treated and untreated seedling stands. Measurements have included both development class T1 (young seedling stand, height less than 1.3 m) and T2 (advanced seedling stand, height over 1.3 m). Plots were circular plots, from which the amount of left and removed trees (stems/ha) and average height (m) was measured. Timing of tending of seedling stands has also been estimated on a scale early-on time-late.
3. Open forest data
The Finnish Forest Centre offers open forest data from Finnish forests. Via Metsään.fi eService was downloaded as spatial data seedling stands belonging to development class T1 or T2. VESA Index of seedling stands in Finland 2018 was calculated for these areas.
In the Finnish open forest data, there are about 1.25 million seedling stands and their area is about 1.93 million hectares. The average size of seedling stands in different regions of Finland varies between 1.24 and 2.61 ha. On average, the largest seedling stands are in Lapland and the smallest in South Karelia.
4. VESA Index
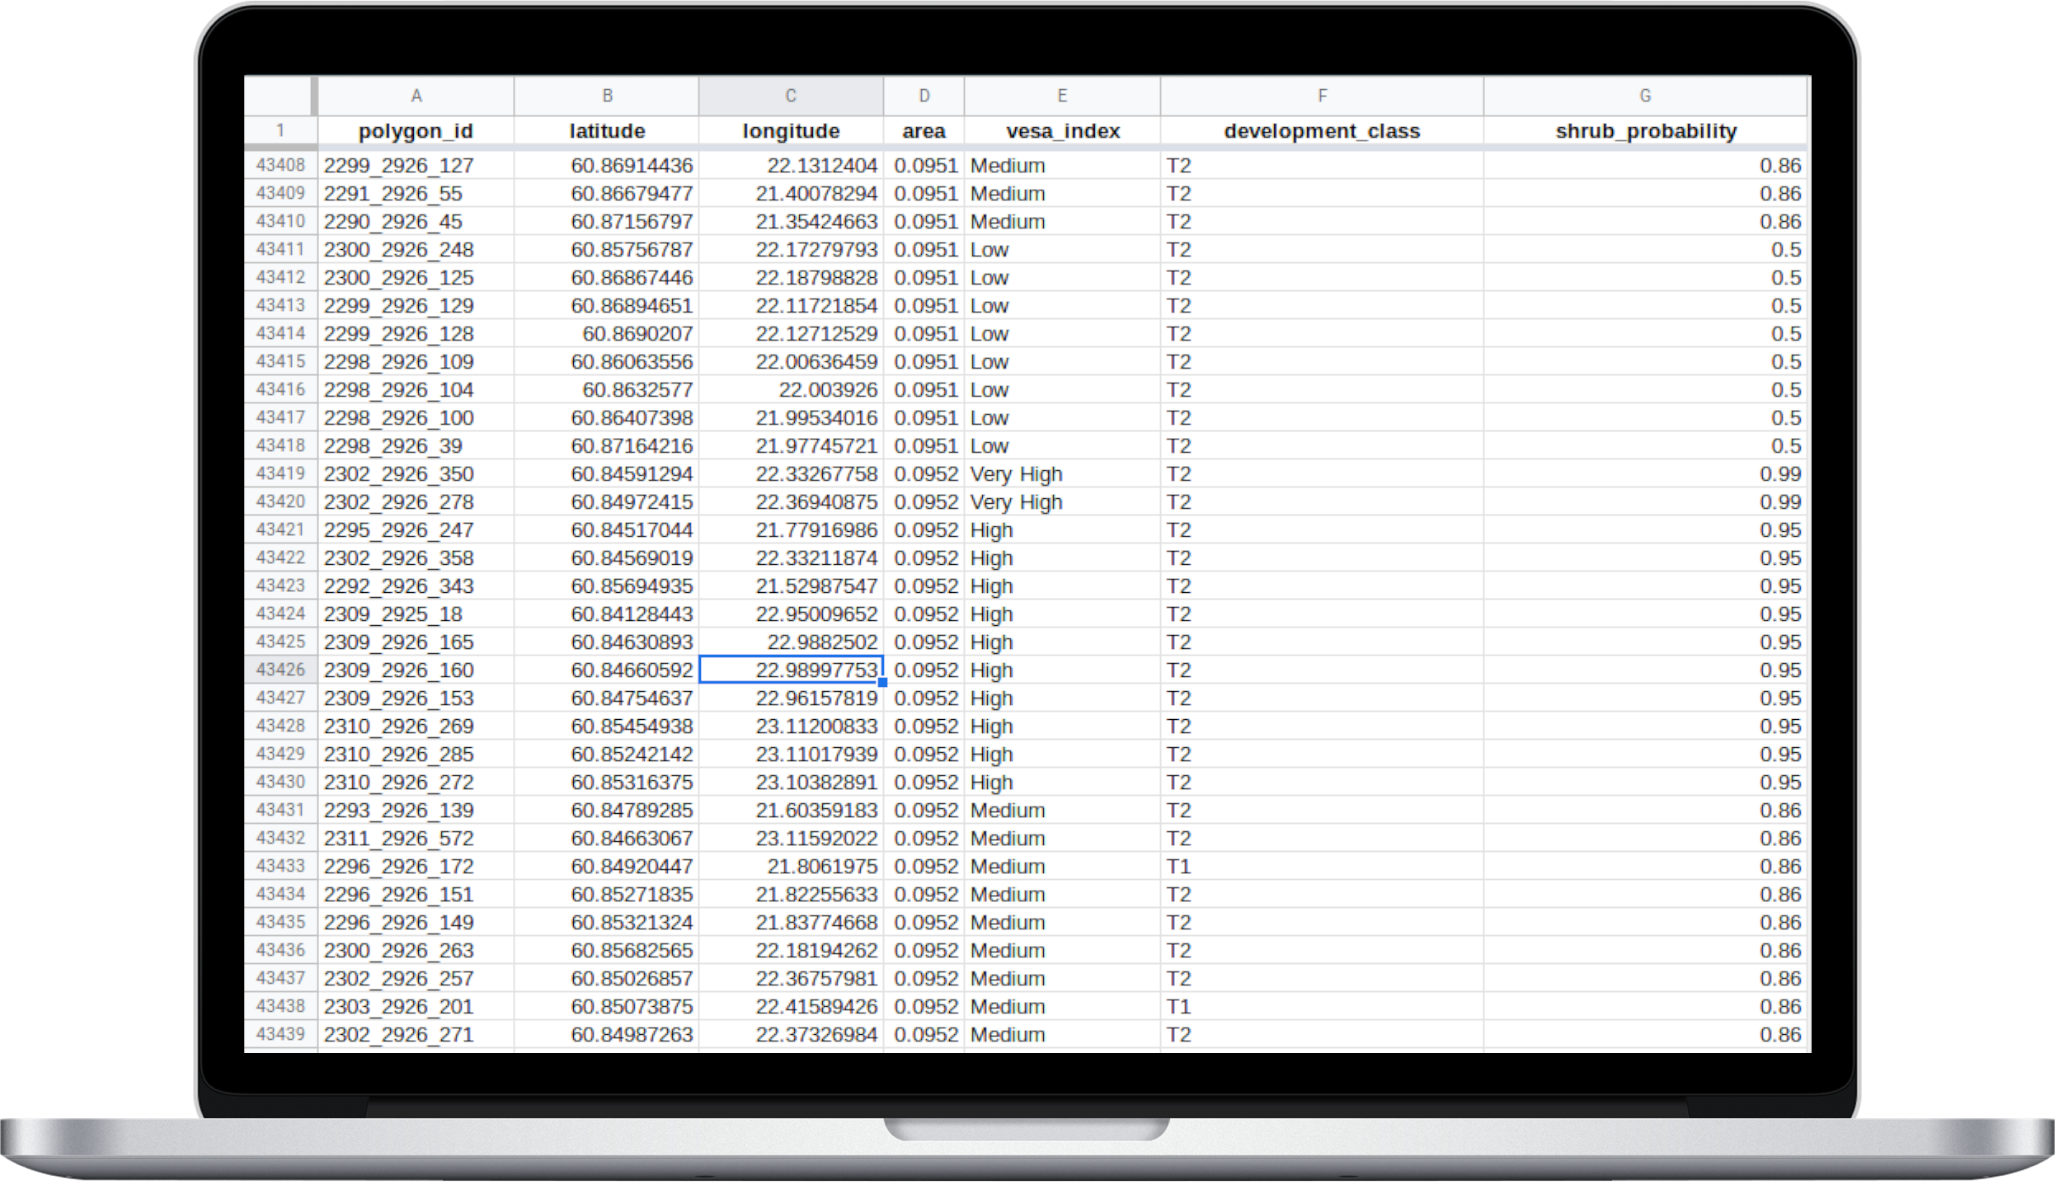
A method to recognize areas of shrubs have been developed together with forest organizations and in ESA Shrub Mapping project led by Terramonitor. In addition, the method has been verified in a thesis about planning for tending of seedling stands employed by Metsähallitus (Nilivaara 2019). Based on the results Terramonitor has developed VESA Index utilizing artificial intelligence and machine learning. VESA Index predicts the probability of shrubs in seedling stands. VESA Index is based on a statistical model, which was created using satellite data and ground measurements. The index can be used to estimate the need for tending of seedling stands in different parts of the forest compartment. VESA Index is classified into five classes: very high, high, moderate, low and very low.
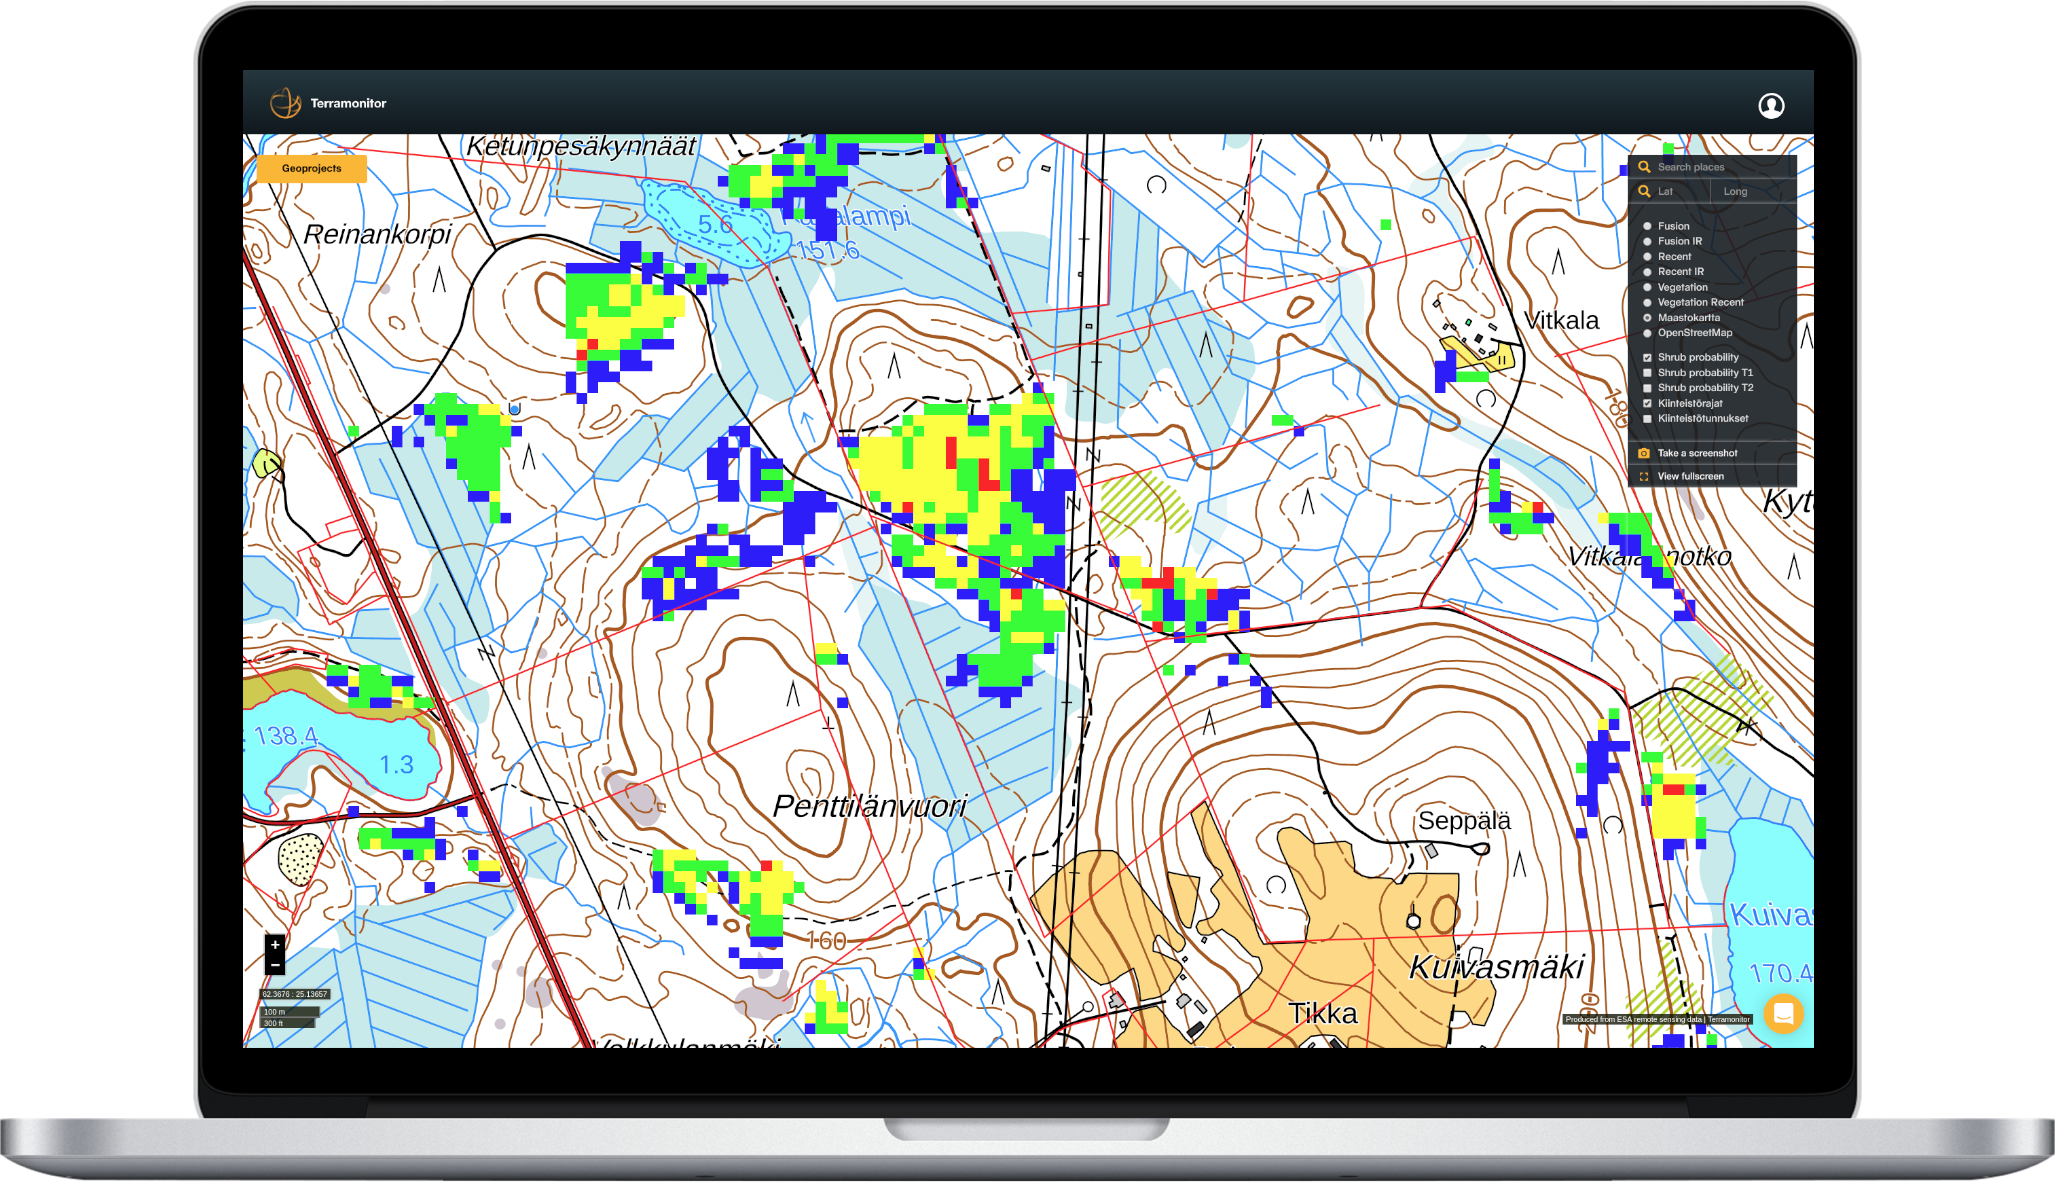
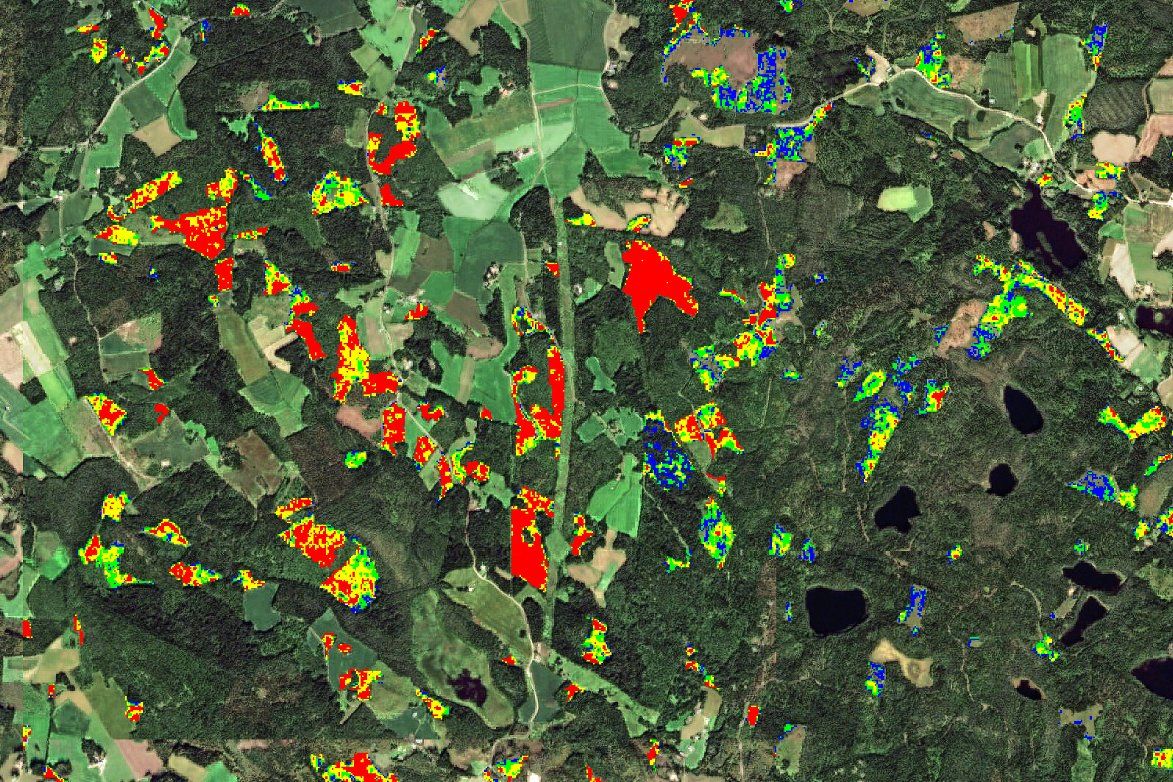
5. VESA Index on a map
The results of the VESA Index are represented in 10 m x 10 m grid. The map layer of the VESA Index is party transparent. On the map is shown parts of seedling stands, which VESA Index is low, moderate, high or very high. The parts of seedling stands classified as very low are transparent on the map. Because of transparency, the results of the VESA Index are easy to use together with other map layers.