Combining geospatial data with Terramonitor and neural networks

A central goal of Terramonitor is to provide easily accessible and up-to-date satellite imagery. There is no one specific use case on how to utilize our data, but rather a world of possibilities. I set out to explore a possible scenario, combining Terramonitor with an external dataset and applying machine learning. The result is a fully functional urbanisation map overlay, albeit the scope of this experiment was proof of concept rather than production ready service.
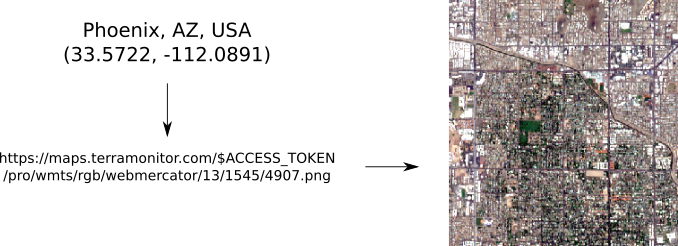
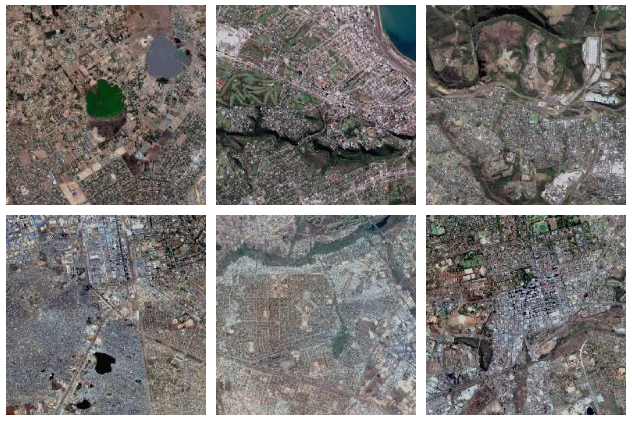
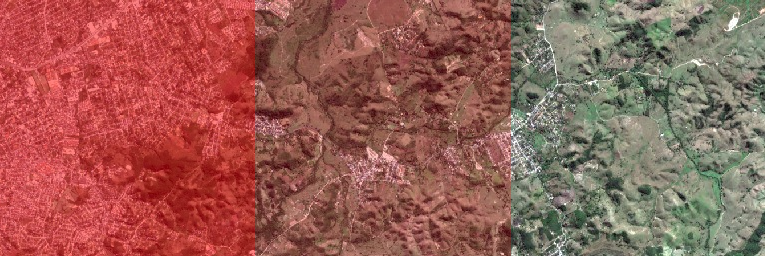
All map layers provided by Terramonitor are georeferenced by definition, which means they can be combined with any other georeferenced data. To find urban areas, I got a list of all the cities of the world with population and coordinates from https://simplemaps.com/data/world-cities. I then extracted all the city centers’ coordinates with a population of more than 200 000, and transformed the coordinates from EPSG:4326 to EPSG:3857 tile numbers. This allowed me to programmatically download images of city centres using the Terramonitor WMTS endpoint, and collect a training set of 2000 images.
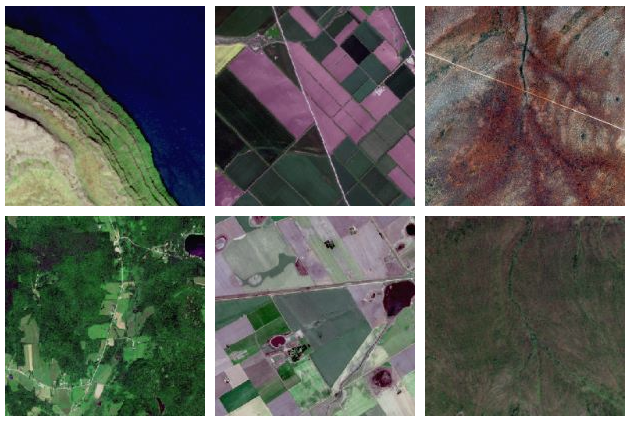
I also collected a training set of 2000 images of places other than cities by simply downloading 2000 random images via the same WMTS endpoint. Seeing as how we have 100 million images in our database, the 2000 randomly selected images proved to indeed be places other than cities. With the training data collected, I uploaded the images to Azure Custom Vision Service, which is a drag and drop solution for implementing image classification using neural networks. The images of cities were tagged with “city”, while the images of places other than cities were tagged “not-city”.
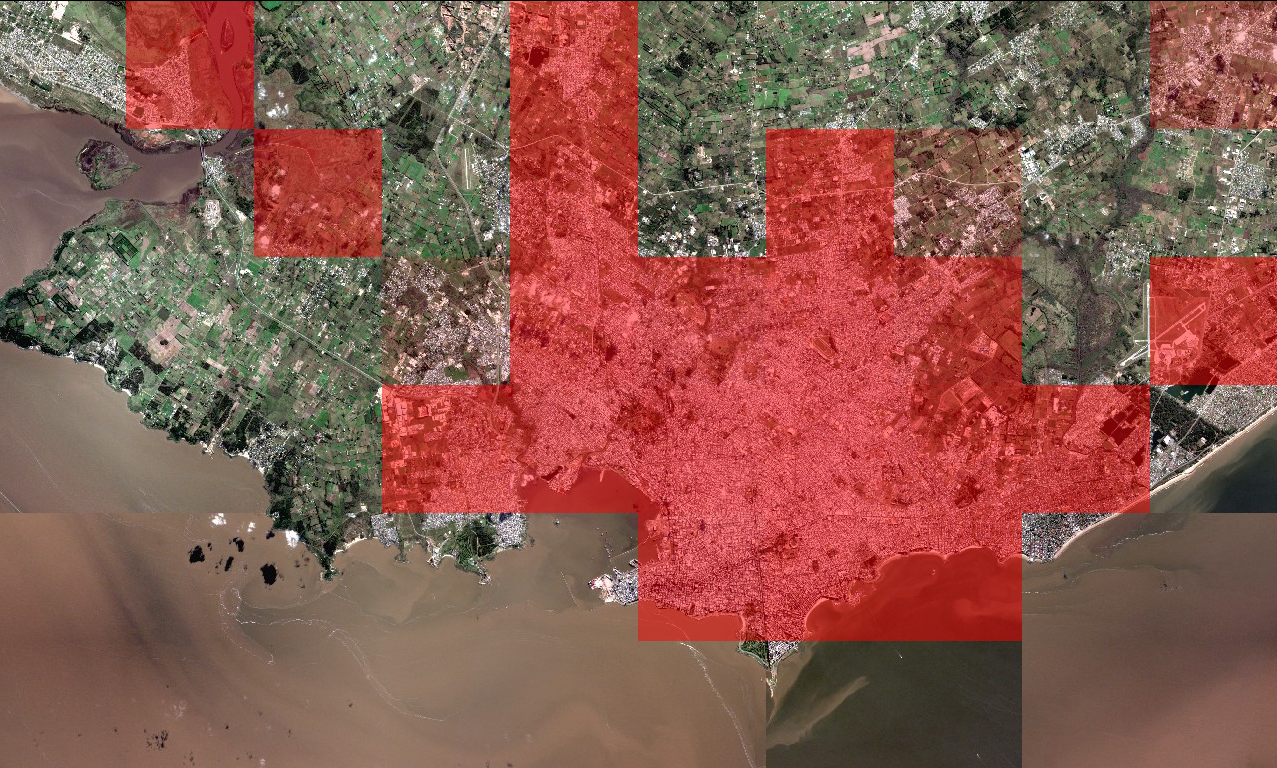
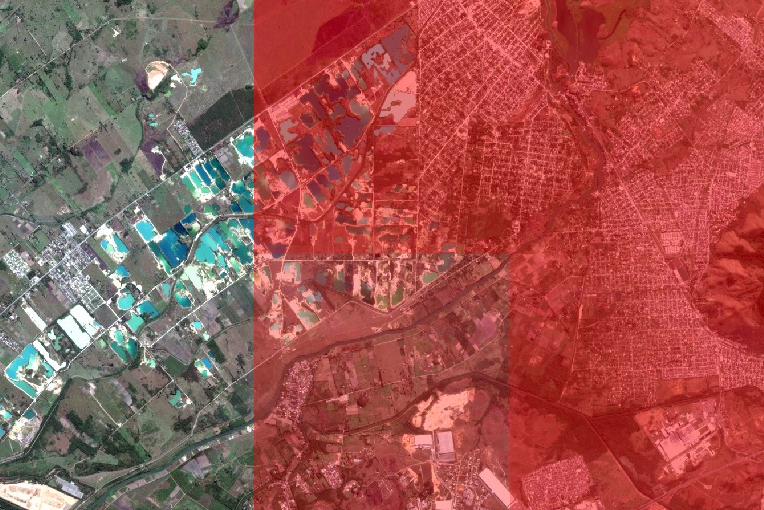
After training the classifier, it was time to test it. I manually collected coordinates for a few rectangular areas, downloaded corresponding map tiles and uploaded each of them to the classification endpoint provided by Azure Custom Vision Service. The response was a likelihood for each of the trained classes (city/not-city). I used the likelihood of the "city" class to scale the opacity of a red image, so that the more likely an image represents a city, the more opaque it is. For rural areas, the image is completely transparent. I saved this result image with the same coordinates as the input image, which meant the resulting image was now also georeferenced, and ready to be uploaded to our map layer database for producing a map overlay.
There are obvious improvements with the process: Training data of cities could be increased tenfold by collecting more accurate city outlines from OpenStreetMap, for instance. Training data for images other than cities could be increased tenfold by simply changing the parameter. The Azure Custom Vision Service could be replaced by a custom machine learning implementation using Python and scikit, for improved control over methods and parameters. For this project, the classification was only performed for a few selected areas, but I could have classified any number of areas anywhere on the globe using Terramonitor, or the entire globe for that matter.
While there was no proper reference data in the scope of this experiment, I would deem the results as “promising” based on visual evaluation. The goal was to prove a concept, and that goal was reached. Terramonitor supports high interoperability by adhering to known standards, and made this type of combination of services relatively easy. In this case, the used methods and technologies only required basic Python programming skills and some understanding of coordinate transformations, while the hard part of applying neural networks was outsourced. Regardless of the machine learning application, sufficient and normalized training data is paramount, and this is what Terramonitor provides.
Start your free trial by signing up at terramonitor.com.